Donor retention is one of those fundraising challenges that quietly haunts nearly every nonprofit. Most donors give once and then… nothing. It’s frustrating, and honestly, it’s more common than you might think. But here’s the thing: it doesn’t have to stay that way. Donor journey mapping is one of the most practical tools you can use to understand where supporters are dropping off and what you can actually do about it.
In this post, we’re going to walk through how to build a donor journey map from scratch, which mistakes to avoid, and how to turn that map into a real stewardship system that keeps donors coming back. Whether you’re brand new to this concept or you’ve heard the term thrown around in strategy meetings, let’s explore it together in a way that’s actually useful.
Why Donor Journey Mapping Is a Retention Lever, Not Just a Planning Exercise
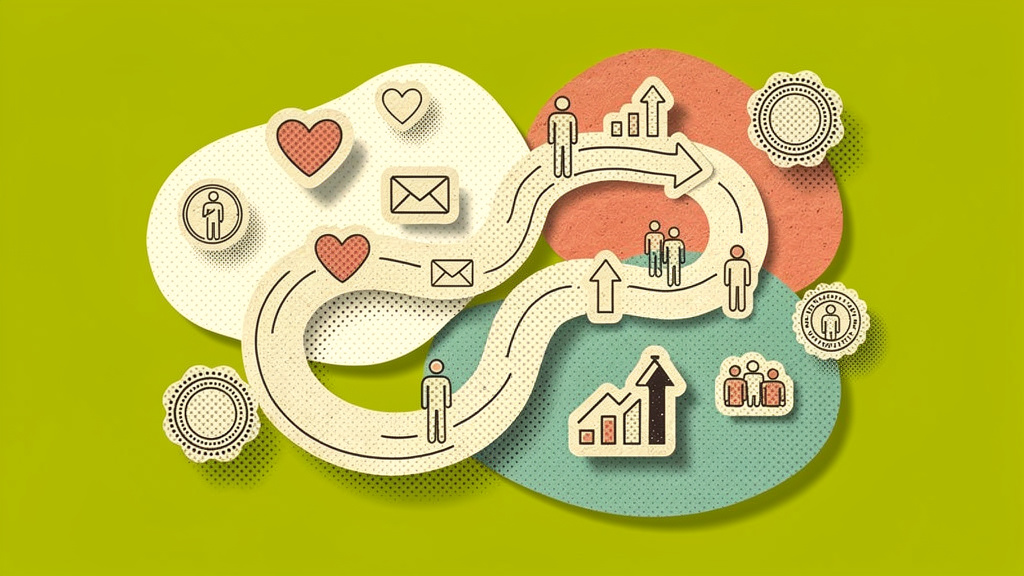
A donor journey map visualizes every touchpoint a supporter has with your organization, from the first social ad they scroll past to the moment they become a recurring monthly donor or even a volunteer. When done well, it transforms fragmented, inconsistent experiences into intentional, empathy-driven paths. Think of it less like a fancy chart and more like a GPS for your donor relationships.
And the business case? Pretty hard to argue with. Retaining donors costs far less than acquiring new ones, yet over half lapse annually (Funraise.org). Monthly donors, by comparison, generate $287 in annual revenue per donor versus $192 for one-time givers, and they sustain retention rates above 87% over multiple years (Funraise.org citing M+R Benchmarks). The math strongly favors investing in stewardship over constantly chasing new names.
So journey mapping supports this by identifying exactly where donors drop off. Is it a confusing donation form? A week of silence after that first gift? Generic emails that feel copy-pasted? Your map surfaces these failure points so your team can actually fix them.
What We See Every Day: Common Mapping Failures in Nonprofits
Before we get into the how-to, it’s worth naming what goes wrong in practice, because we see these patterns constantly.
“We send one thank-you email and call it stewardship.” A lot of nonprofits treat acknowledgment as the finish line. The donor gives, the receipt goes out, and then nothing for months until the next campaign. A map would clearly show that the Retention stage is completely empty of meaningful touchpoints.
“Our data lives in three different places and nobody owns it.” CRM, email platform, event registration system, each managed by a different staff member. Without integrated data, you can’t map what actually happened. You can only guess.
“We know our lapsed donors are a problem, but we don’t know why they lapsed.” Without a mapped journey, there’s no systematic way to trace back where engagement broke down. Was it after the first gift? After an event? Journey mapping gives you the diagnostic tool you’ve been missing.
If any of these hit close to home, you’re not alone. And the good news is that building even a basic journey map starts addressing all three.
Building Donor Personas Before You Build Anything Else
Effective donor journey mapping starts with personas. A donor persona is a semi-fictional profile built from real CRM data, giving history, demographics, and motivations. Without them, your map will be too generic to drive any real action.
Three practical steps to build yours:
- Pull behavioral data from your CRM: average gift size, frequency, acquisition channel, event attendance,
- add motivational context through short surveys or post-gift feedback forms — why did they give and what do they care about?,
- build 3-5 profiles maximum, each with a name, age, giving preferences, preferred communication channel, and a key frustration (say, “never knows if her donation made a difference”).
A well-built persona might look like: “Marcus, 42, urban professional, gives $75-150 via mobile, motivated by local impact, frustrated by impersonal mass emails, prefers SMS updates over newsletters.”
Protip: Test your personas with a small survey sent to current donors before finalizing them. Even 20 responses can sharpen your assumptions significantly. Funraise’s dashboard tools make segmenting and tracking these groups straightforward, and you can start exploring the platform for free with no commitment required.
The Five Stages of the Donor Journey
Every donor journey, regardless of your cause or donor segment, moves through five core stages. Here’s how to think about each one strategically:
| Stage | What the Donor Experiences | Priority Touchpoints |
|---|---|---|
| Awareness | Discovers your cause; curious but uncommitted | Social ads, peer-to-peer shares, SEO content |
| Consideration | Researching; comparing options | Website, impact reports, email nurture |
| Decision | Commits to giving; excited but possibly anxious | Donation form UX, clear CTAs, social proof |
| Retention | Post-gift; looking for validation | Thank-yous, impact updates, receipts |
| Loyalty/Advocacy | Deeply connected; wants to deepen involvement | Events, volunteer opportunities, upgrade asks |
The Retention and Loyalty stages are where most nonprofits under-invest. Plugging those gaps is where donor journey mapping creates the most immediate ROI, and honestly, it’s the lowest-hanging fruit on the whole tree.
Try This AI Prompt to Map Your Donor Journey Faster
Okay, we’re going to break the fourth wall here for a second: yes, we’re including an AI prompt in an article about human connection and donor relationships. A li’l ironic, we know. But used well, AI can dramatically speed up the drafting phase so your team can spend more time on the actual relationship-building. So here we go.
Copy and paste this into ChatGPT, Gemini, Claude, Perplexity, or whichever tool you’ve jumped on the bandwagon with, and customize the four variables in brackets:
You are a nonprofit fundraising strategist specializing in donor retention. Help me build a detailed donor journey map for [ORGANIZATION TYPE, e.g., animal rescue nonprofit]. Our primary donor persona is [PERSONA DESCRIPTION, e.g., female, 35-55, gives $50-200 annually via email campaigns]. Our current biggest retention challenge is [CHALLENGE, e.g., donors do not give a second time within 12 months]. For each of the five stages (Awareness, Consideration, Decision, Retention, Loyalty), list the top three touchpoints, the likely donor emotion at that stage, and one specific action our team should take to move the donor to the next stage. Format as a table.This gives you a working first draft in minutes. That said, for daily nonprofit operations, it’s worth leaning on platforms like Funraise that have AI components built directly into where the work actually happens, with full operational context already in place, rather than toggling between standalone tools all day.
Retention Strategies That Come Directly From the Map
Once your map exists, it becomes your stewardship calendar. Here’s a concrete post-gift sequence that high-performing nonprofits use:
- Day 1: personalized thank-you (not a receipt, an actual thank-you with their name and what their gift specifically supports),
- Week 1: an impact snapshot tied to their specific donation amount,
- Month 2: a soft upgrade ask with recurring giving framed as convenience, not obligation,
- Month 4-6: a re-engagement touchpoint for anyone who hasn’t interacted since giving.
Online one-time donor retention was 29% in 2022, while repeat one-time donors reached 49% (Funraise.org citing M+R Benchmarks). That 20-point gap is closed almost entirely through intentional follow-up, which your map makes systematic rather than accidental.
For lapsed donors, map their drop-off point first. If they consistently disappear after the first gift, the problem lives in your Retention stage. If they disappear after 18 months, look at your Loyalty-stage touchpoints instead.
“The most dangerous assumption in fundraising is that a donor who gave once already understands your value. The journey map exists to prove it to them, repeatedly.”
Funraise CEO Justin Wheeler
Protip: Treat your donor journey map as a living document, not a one-time deliverable. Review it quarterly and update it when donor behaviors shift, economic conditions change, or new acquisition channels come online. Organizations who revisit their maps regularly are far more responsive when something quietly starts breaking down.
Starting Small: A Practical Roadmap for Nonprofits at Any Stage
You don’t need a six-figure tech stack to build a useful journey map. Here’s a realistic implementation path:
- Week 1: audit your existing data and define 2-3 donor personas,
- Week 2: draft your map for one segment only (new donors are the highest-ROI starting point),
- Month 1: test 2-3 new touchpoints in the Retention stage and measure open and click rates,
- Ongoing: track retention rate by segment using this formula: repeat givers divided by prior period total, multiplied by 100. A healthy benchmark target is 50-60% (sopact.com).
Tools worth knowing: Funraise for CRM data and dashboards, Lucidchart for visual mapping, and Google Analytics for tracking site behavior at the Awareness and Consideration stages.
The point is this: donor journey mapping isn’t a luxury for large nonprofits with dedicated data teams. In our experience, it’s a practical, scalable discipline that any organization can begin with one persona and one stage. Start there, prove the value, and expand from it.
If you want to see how integrated data makes journey mapping faster and more accurate, Funraise offers a free tier that lets you explore the platform without any upfront commitment. The sooner your data lives in one place, the sooner your map reflects reality instead of assumptions.
About the Author

Thank You Notes for Donations: Templates for Every Occasion
Gratitude is one of those things that sounds almost too simple to be strategic. And yet, in the world of nonprofit fundraising, a well-timed, well-crafted thank you note might be the single most underrated tool in your entire operation. It's not just about being polite. It's about building the kind of relationship where a first-time…
The Donor Cycle: From First Gift to Lifetime Supporter
Most nonprofits pour enormous energy into acquiring new donors, then treat retention as an afterthought. The result is a leaky bucket that demands constant refilling. The donor cycle framework flips this logic entirely, treating every gift not as a transaction but as the beginning of a relationship worth investing in for years to come. In…
What are Donor Relations? Why They Are the Core of Your Mission
Look, if you're running a nonprofit, you've probably noticed that building relationships with donors feels a lot like maintaining friendships. And here's the thing: donor relations is exactly that kind of ongoing connection, just with the people funding your mission. It's the art of transforming supporters from one-time givers into lifelong partners who genuinely care…